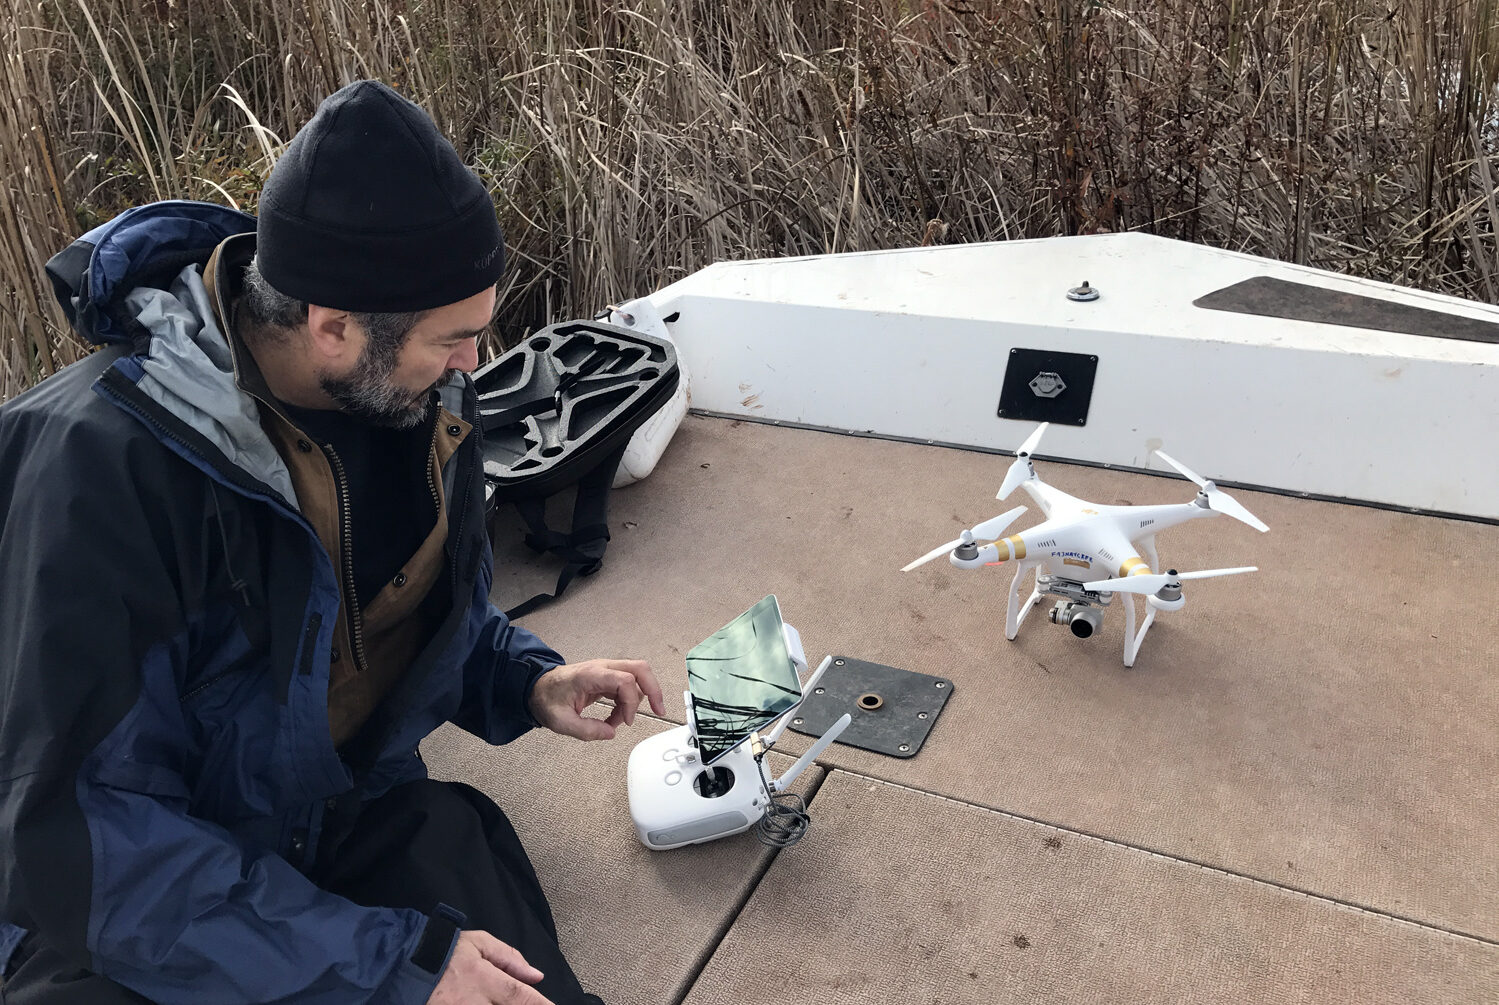
AERIAL PHOTOGRAPHY & VIDEOGRAPHY
We have unmanned aerial vehicles (UAV) in our repertoire of specialty equipment. We currently operate under part 107 of the Federal Aviation Regulations.
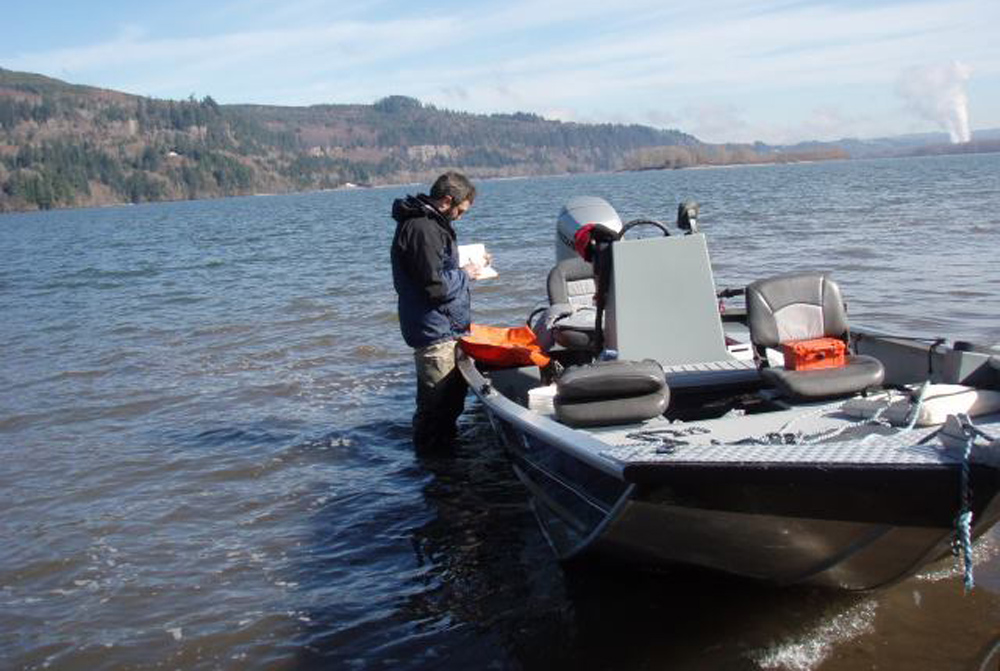
WATER QUALITY ASSESSMENT
We provide detailed assessments of water quality (nutrient concentrations and limitation, dissolved oxygen, bioindicators, and primary production) for lakes and streams.
HABITAT MAPPING
We use Geographic Information Systems, field surveys, and Remote Sensing to produce spatial data sets describing the location and distribution of biological communities.
SPATIAL ANALYSIS & ASSESSMENT
We collect data and use a variety of ecological approaches to examine patterns in the abundance and distribution of organisms and the factors that influence these patterns.
Aerial Photo and Video
Oblique aerial photographs and 4K video
Professional photo and video editing
Photo mosaicing
Spatially referenced photo mosaics
Elevation mapping
3D mapping
Our Areas of Expertise
Our studies range from individual wetlands to regional landscapes, from molecules to biological communities. We specialize in an array of ecological methods and emerging technologies. Our areas of expertise include:
Watershed Assessment
Geographic Information Systems and Remote Sensing
Landscape Ecology
Limnology
Aquatic Invertebrates and Stream Monitoring
Wetland Restoration and Assessment
Plant Community Assessment and Monitoring